In brief
- I recently flew through a severe weather warning for storms in Germany and tested several turbulence forecasting tools
- In this article I compare the predictions of Turbli, Turbcast, Zero Turb, ICON-D2 and the ECMWF
- TLDR: none of the commercial turbulence forecast tools was accurate and, if I believed them, would have increased my anxiety
- Pilots avoided the most severe thunderstorms and the turbulence we experienced was light to moderate
Do thunderstorms cause turbulence?
Can planes safely fly through thunderstorms? It’s one of the most common questions from nervous flyers.
During my flight from Munich to Bristol, a line of severe thunderstorms stretched across Germany, with official weather warnings for storms, icing and moderate turbulence.
Before boarding, I compared five turbulence forecasting tools – including Turbli, Zeroturb and several professional aviation weather models – to see which predicted the flight most accurately.
Most public turbulence apps significantly overestimated the bumps, while the professional aviation forecasts were much closer to what we actually experienced.
Here’s what happened and what I discovered when comparing turbulence forecasting apps and tools.
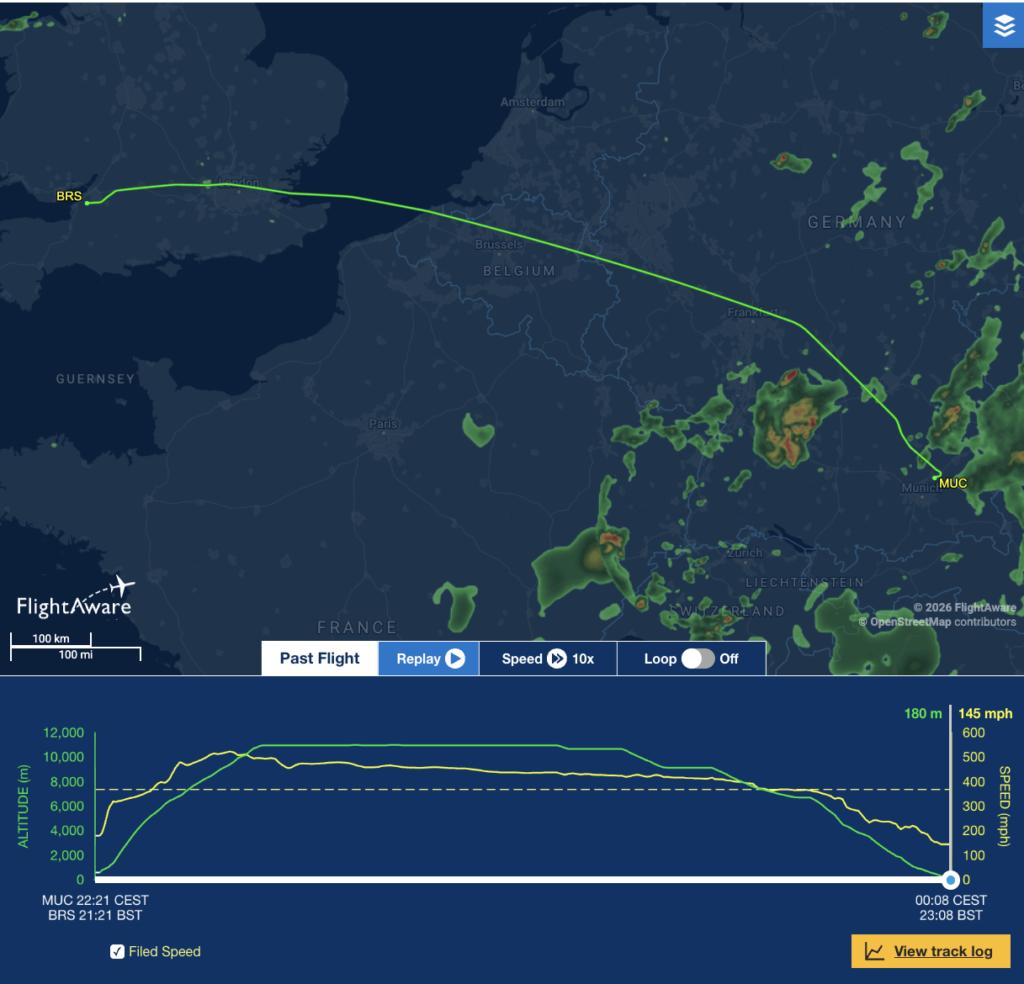
(The flight was Easyjet EZY2930 from Munich to Bristol on 31 July 2026. I sat in seat 19F just behind the wings – my favourite seat for stability while also enabling me to see out of the window. You can find the full track log here.)

What was the weather forecast?
After record highs of 38 degrees, southern Europe was braced for severe thunderstorms. According to the German Meteorological Service (DWD), several regions were at risk of severe weather.
Several significant weather warnings (SIGMETs and SigWxs) were issued for thunderstorms, icing and moderate turbulence – the kind of thing that causes fear in many flyers.
You can see them here:


The severity of the storms made national news (if you can understand German!)
Any anxious flyer watching the news would be braced for a fearful flight.
Easyjet, too, had come prepared with passengers giving an eco-friendly “comfort” bag for the journey.
But what was the reality?

What the turbulence forecasts said
To see how accurate turbulence forecasts were, I flight tested the predictions of three turbulence forecasting tools and two advanced weather systems, including:
Here’s what the turbulence forecasts said and how accurate (and inaccurate!) they were.
Turbli
Turbli forecast half an hour of rollercoaster moderate turbulence that would tail off after half an hour.
The forecast changed several times in the run up to the flight, and wasn’t adjusted when the flight departure time changed.
The major flaw in this model is its routing and altitude. In severe weather conditions, when strong storm systems are present, pilots will work with flight planners and air traffic control to find the best route through the conditions.
Turbli doesn’t have access to this information and assumes you’ll simply fly through the worst of the severe weather, which would never happen.


Result:
The forecast moderate turbulence that was predicted was far in excess of anything we experienced (which was light to moderate at best). It was intermittent and reduced after we reached cruise altitude.
While the forecast was accurate to a degree, the prediction of moderate turbulence and the flaws in its routing and altitude would have created more anxiety.
Accuracy: 2/5
Anxiety: 4/5
Overall: 2/5
Turbcast
Turbcast is a free turbulence forecasting tool that uses a lot of science-sounding words to establish its credentials, yet makes the same simple errors as other forecasting tools.
The Turbcast model forecast half an hour of moderate turbulence on departure. In contrast to Turbli, Turbcast also predicted a bumpy landing in Bristol.
Calculations were based on the plane flying at 33,000 feet and in a straight line from Munich to Bristol (not the geodesic routing that Turbli uses).

Result
The Turbcast prediction of moderate turbulence would have increased anxiety but again, it wasn’t correct. The prediction was graded as “Good” by the system, which could suggest to users that it’s more accurate than it actually is.
The pilot (as you can see below) threaded his way through the storm system and varied the plane’s height to make the ride as smooth as possible.
The interface is more professional and friendlier than Turbli with several soft signals to users to reduce anxiety.
Accuracy: 1/5
Anxiety: 3/5
Overall: 2/5
Zeroturb
Zeroturb is another free turbulence prediction tool that offers free forecasting for flights. Unfortunately, the system failed to identify my flight, continually getting the time wrong.
I tried several times to generate a forecast, but it failed every time.


Result
The forecast was useless.
Accuracy: 0/5
Anxiety: 5/5
Overall: 0/5
ICON-D2
ICON-D2 is an ultra-high-resolution regional weather forecast model that’s operated by the German Weather Service. It covers the whole of Germany (and a little of surrounding countries).
The model forecasts severe weather like thunderstorms over a 2.1 km horizontal grid spacing, making it much more precise than Turbli and other models.
The forecast is one of several models available for free to users through Swiss site Meteologix.
These are professional models designed for metrologists. The information is displayed without any context, comment or prediction.


Result
Before I flew, I checked the ICON-D2 model to see where storms were and, more importantly, where they were moving.
You can see the model was hugely accurate on the location of storms and movement, highlighting a clear line through the weather.
While convective turbulence can spread beyond storm systems and linger in the atmosphere, seeing a clear run through the storms gave me confidence.
Accuracy: 5/5
Anxiety: 0/5
Overall: 5/5
ECMWF Clear Air Turbulence
The European Centre for Medium-Range Weather Forecasts (ECMWF) is an international collaboration between UK and European scientists, researchers and metrologists.
It has two clear air turbulence prediction models: Clear air turbulence (CAT) and Probabilities: Clear air turbulence (CAT), as well as a range of other weather forecasting tools.
The model is regularly updated and as well as CAT caused by things like the jetstream, the model is also calibrated to include turbulence caused by convective activity (like thunderstorms).
The SIGMET and SIGWX both suggest significant upper air disturbance, so I checked the ECMWF charts to see what was happening at altitude – and what we could expect during the flight.

Result
The ECMWF model predicted smooth skies across Europe for the majority of the flight.Storms around Frankfurt caused some light-moderate chop which wasn’t captured by te model, but this is understandable in a dynamic weather system like we experienced.
The model primarily focuses on upper-level turbulence, and doesn’t contain information on low-level turbulence under FL140 (like that often caused by thunderstorms).
The interface is simple to use and easy to navigate. Like all turbulence prediction tools, there are limitations, but it’s a professional product that’s often used in aviation.
Accuracy: 5/5
Anxiety: 0/5
Overall: 5/5
Easyjet pilots: The reality of the in-flight experience
This was a routine summer flight with intermittent light to light-moderate turbulence. There was nothing here to cause concern.
Everything progressed smoothly, calmly and professionally with the pilot taking every opportunity to inform and reassure passengers.
Boarding and announcements
Boarding for the flight was rushed as the flight crew wanted to leave before the weather window closed. Entering the plane, everything was calm with the crew polite and professional.
The pilot warned us at takeoff to expect some turbulence before cruise, which would be smoother.
The announcement was clear, honest and calm.
The pilot would have had access to the most up-to-date information. He had also flown this route shortly before, with the plane travelling from BRS to MUN before returning.
I know that predicted turbulence can frighten some passengers, but the explanation of why it would happen, how long it might last and the fact that they were doing everything to minimise it was hugely reassuring to passengers.
Initial climb
The initial part of the climb we experienced light turbulence with regular chop. The plane moved in the wind and we experienced several drops, although not hugely dramatic.
While the crew remained strapped in, the drops would be best described as light to light/moderate.
Looking out of the window, we could clearly see lightning flashes several miles away.
According to the forecasting tools, the first 40 minutes of the flight were predicted to be a rollercoaster of moderate turbulence. In the end, it turned out to be intermittent light-moderate as the plane ascended through cloud levels and around weather systems.
After approximately 30 minutes, the seatbelt sign was switched off and service began. It continued throughout the flight.
Cruise
As the flight path and log shows, the pilot was able to steer around the yellow and red storm clouds.
There were pockets of turbulence that momentarily shook the plane, with strong winds buffeting at times. But nothing beyond light turbulence, with service continuing through the flight.
It was calm enough for me to eat (if not enjoy) a lasagne.
Landing
Zeroturb predicted a bumpy landing (which is fairly common in Bristol, with the airport buffeted by Atlantic winds).
In the end, it was a routine and relaxed landing. Yes, were some light bumps and drops that you expect of a summer landing, but nothing scary.
The flight touched down at the precise time predicted by the captain.
Accuracy: 5/5
Anxiety: 0/5
Overall: 5/5
Turbulence forecasting tools rated
- In-flight announcements from the pilot: The latest information, clearest explanations and anxiety reduction.
- ICON-D2: Simple charts which are incredibly accurate.
- ECMWF Clear Air Turbulence forecast: Science backed forecasting tool that suitable for broad predictions.
- Turbli: Inaccurate and anxiety creating, but the best forecasting tool we used.
- Turbcast: Predicted a bumpy landing when smooth, route planning assumed a straight line, overall poor.
- Zeroturb: Didn’t recognise the flight time which misrepresented the forecast. The tool is likely broken.
Turbulence: Reality v prediction
Turbulence forecasting apps and tools suggested we’d be in for a frightening flight. The reality was a regulation flight punctuated with a few intermittent parts of light to light-moderate turbulence.
If I didn’t understand how the tools work and their rudimentary logic, I’m certain that my anxiety would have spiked.
The reality was much calmer and relaxed than the prediction.
Why?
Because everyone in the system was doing everything they could to ensure we had a safe, smooth and relaxed flight.
It’s what they do every day.
Trust the pilot and the other professionals who are doing everything they can to keep you and the other passengers safe.
My flight will takeoff during thunderstorms. What should I do?
Firstly, don’t check turbulence forecasts. As we’ve evidenced, they don’t reflect the reality of the flight experience. They can’t predict the weather with any accuracy and their flight routing and flight level predictions are irrelevant.
If you want to know what’s actually happening with storms, check a professional weather forecast like ICON-D2 (or the equivalent tool for the countries you will fly over).
The best source of information? The pilot on the flight deck.
On flight EZY2930 from Munich to Bristol, the pilot explained precisely what would happen. The course they plotted managed to miss out the storms and was, for the most part, calm.
Wasting hours worrying about the flight would have no impact on the reality of the experience.
Don’t waste your time – or money – on turbulence forecasting tools. Trust the pilot, flight planners and safety systems that exist.
They kept me and my family safe, and they’ll do the same for you, too.
Have a safe flight!
Please share this with anyone who might benefit from it.
FAQs
Most commercially available turbulence apps aren’t accurate. They often overestimate the level of bumps because they lack access to real-time pilot information, air traffic control adjustments, and actual flight routing. Professional aviation weather models like ICON-D2 or ECMWF provide a much more precise picture of weather systems.
Turbulence alone is extremely unlikely to cause a plane to crash. Commercial aircraft are designed and tested to withstand forces far greater than those encountered in real-world turbulence. The main risk during turbulence is potential injury to passengers who are not wearing their seatbelts, rather than structural failure.
Turbulence is not caused by the ocean itself but by weather systems like the jetstream. Some oceanic routes can experience turbulence due to these global weather patterns, but flying over water is not inherently more dangerous. Pilots actively monitor and navigate around severe weather to ensure a safe flight regardless of whether they are over land or sea.
Avoid checking unreliable turbulence apps, as these can increase anticipatory anxiety. Focus on preparation and grounding techniques, such as the 5-4-3-2-1 method or box breathing. Trust the flight crew and the safety systems in place, as they are equipped with the most accurate and up-to-date information for your journey. If you’re worried, download the free Calm Flight Toolkit and visit the Help Desk.